Free Vacation Rental Calculator
Model vacation rental revenue, occupancy, and net return — then compare it against a flip or long-term rental to find your best exit.
Tell Freddie about your vacation rental:
What you get — free
STR Revenue Model
Nightly rate × occupancy with conservative, moderate, and peak-season scenarios.
True Expense Breakdown
Platform fees, management, cleaning, utilities, insurance, and maintenance — all included.
STR vs Long-Term Compare
Side-by-side comparison so you know whether vacation rental beats a standard tenant in your market.
Deal Score 0–100
Freddie grades your vacation rental deal A–F before you put money down.
Regulatory Risk Flag
Freddie flags STR regulatory risk in your market — the #1 reason vacation rental projections fail.
Free Forever
Core analysis permanently free. No credit card.
Why a suburban hoarder house isn't a vacation rental — and what we did instead
Location is everything for vacation rentals. This Northern Virginia hoarder house was in a suburban residential neighborhood with zero tourism draw. No waterfront, no mountains, no destination appeal. Even after a full renovation, nightly rates would have been $110–$130 at 55% occupancy — roughly $22K gross annually. Operating costs would have eaten half. Compare that to our wholetail exit: $115,050 in 30 days. Some properties are vacation rentals. This one was a flip. Freddie scored it 100/100 and the vacation rental math confirmed the decision.
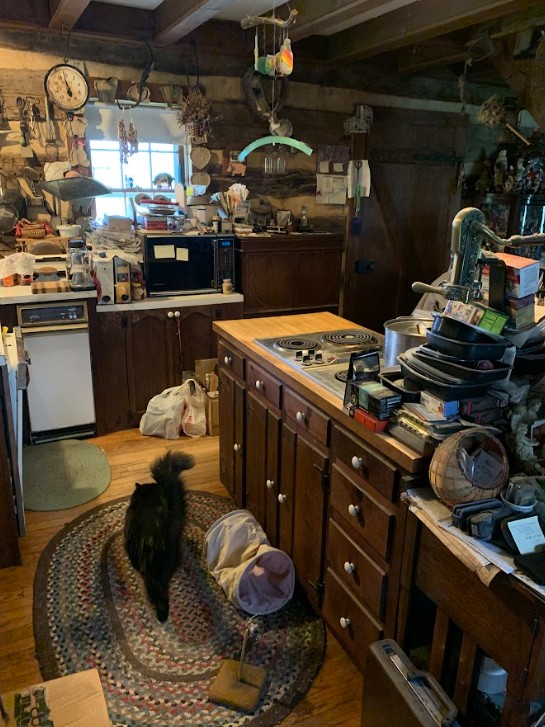
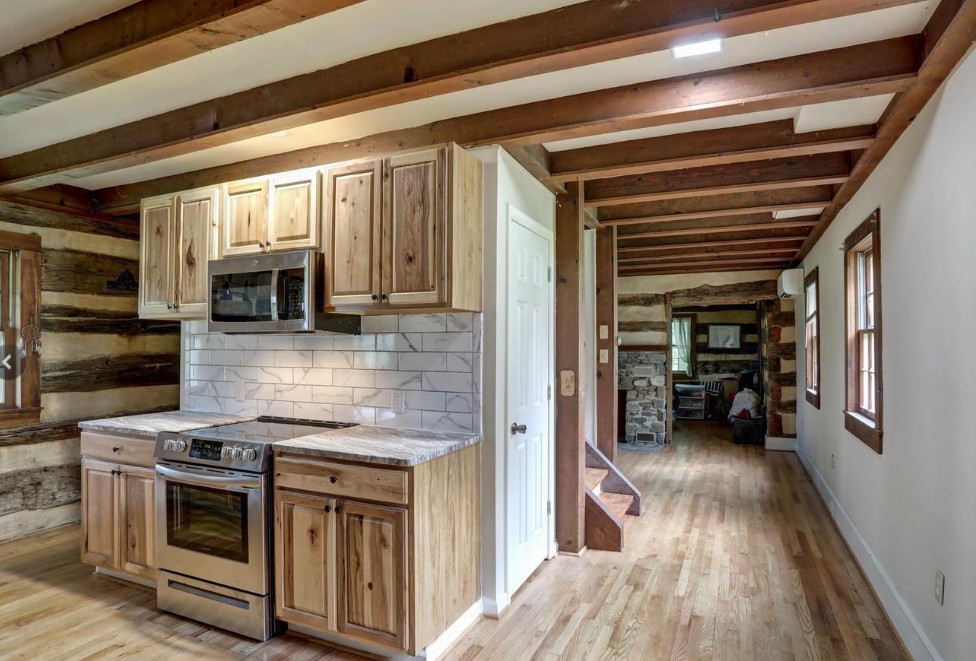
We sold the property as-is for $349K. The renovation pictured was completed by the buyer who purchased it from us. The $115,050 profit reflects our wholetail exit, not the renovation work.
Freddie scored the wholetail 100/100. The vacation rental analysis ruled out that exit in seconds — freeing us to focus on the strategy that actually won.
"Vacation rental lesson: the best vacation rental calculator tells you no just as quickly as it tells you yes. Know when the location doesn't support STR before you buy."
Vacation Rental FAQ
How do I calculate vacation rental income?
Vacation rental revenue = average nightly rate × occupied nights. Net income = gross revenue minus platform fees (3%), property management (15-25%), cleaning fees collected vs paid, utilities, insurance, maintenance, and supplies. Freddie models all of it.
What occupancy rate should I assume for a vacation rental?
Occupancy varies dramatically by location and season. Coastal and mountain markets with strong tourism see 65-80%+ in peak season but may drop to 30-40% off-peak. Annual average of 55-65% is realistic for most established vacation markets.
Is vacation rental better than long-term rental?
In tourist markets, vacation rental can generate 2-3x long-term rental income. However, STR has higher management complexity, more wear and tear, seasonal cash flow variance, and significant regulatory risk. Always model both.
What regulations affect vacation rentals?
Many markets require STR permits, impose night caps, mandate owner-occupancy, or restrict rentals in residential zones. HOAs often ban STR entirely. Regulatory risk is the #1 reason vacation rental projections fail — Freddie flags it.
How much does vacation rental management cost?
Full-service vacation rental management runs 20-30% of gross revenue. Self-management with a cleaning service runs 8-12%. Factor in both scenarios — Freddie models the difference in net returns.
Can I flip a property and then use it as a vacation rental?
Yes — a flip-to-STR strategy can work in strong vacation markets. Renovate to vacation rental standards, list immediately after completion. Freddie models the flip ROI and ongoing STR cash flow together.
Analyze your vacation rental now
Free. No credit card. No expiration.