Free Airbnb Calculator
Model short-term rental revenue, occupancy, expenses, and net return — and compare it against a flip or long-term rental exit.
Tell Freddie about your STR deal:
What you get — free
STR Revenue Model
Nightly rate × occupancy modeling with conservative, moderate, and optimistic scenarios.
True Expense Breakdown
Management fees, cleaning, platform cuts, utilities, insurance — Freddie includes them all.
STR vs Long-Term Comparison
See whether Airbnb or a standard tenant nets more cash flow in your market.
Deal Score 0–100
Freddie grades your STR deal A–F against all key metrics before you buy.
Regulation Risk Flag
Freddie flags STR regulatory risk in your market so you know what you're walking into.
Free Forever
Core analysis always free. No credit card. No trial.
Why this hoarder house wouldn't have worked as a short-term rental
Someone asked us about listing this Northern Virginia hoarder house on Airbnb. We ran the numbers. After $40–60K in renovation to make it STR-ready, the location (suburban, non-tourist corridor) would have supported maybe $120/night at 60% occupancy — roughly $26K gross, $16K net annually. Compare that to a wholetail exit at $349K for $115K profit in 30 days. There's no version of the Airbnb math that wins here. The market told us to flip — and Freddie confirmed it with a 100/100 score.
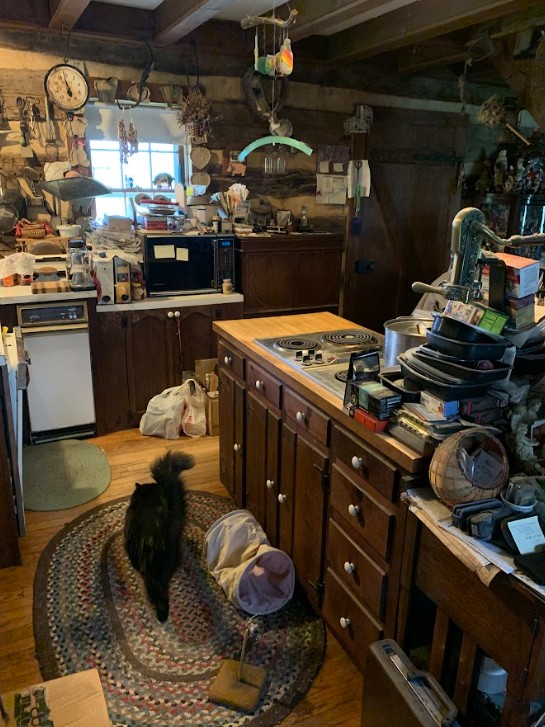
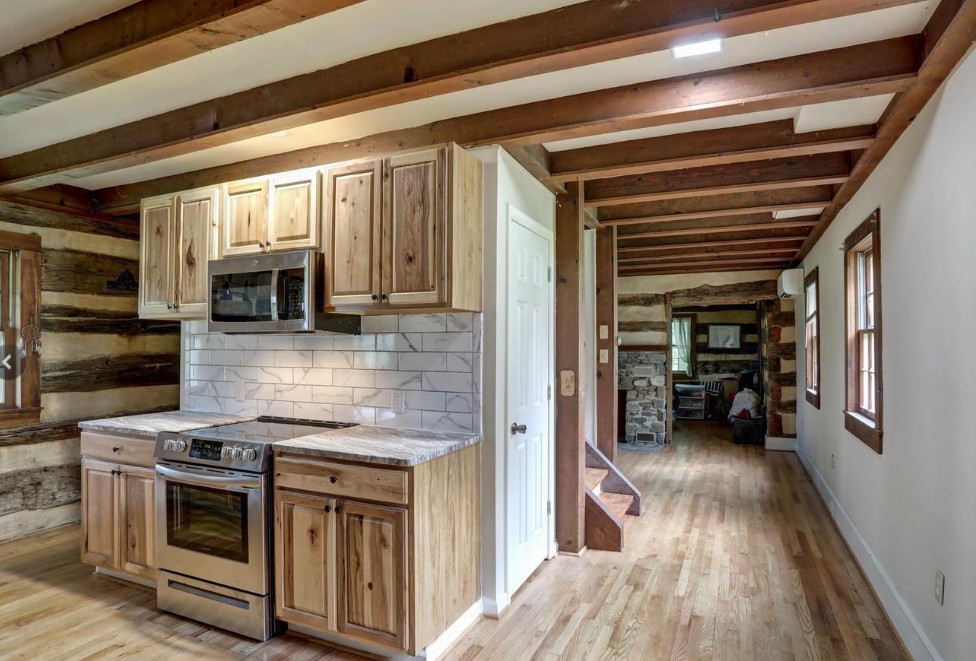
We sold the property as-is for $349K. The renovation pictured was completed by the buyer who purchased it from us. The $115,050 profit reflects our wholetail exit, not the renovation work.
Freddie scored the wholetail at 100/100. The Airbnb path would have taken 7+ years to match the same return. Let the data choose your exit — not the hype.
"Airbnb calculator lesson: STR can be the right exit — but only if the location, numbers, and regulations all align. Run the comparison before you commit to renovation."
Airbnb Analysis FAQ
How do I calculate Airbnb rental income?
Airbnb revenue = (nightly rate × nights occupied). Net income = gross revenue minus cleaning fees, platform fees (~3%), property management (15–25% for STR), utilities, insurance, and maintenance. Freddie models it with realistic occupancy assumptions.
What occupancy rate should I use for Airbnb analysis?
Conservative analysis uses 60–65% occupancy. Optimistic uses 75–80%. Markets vary widely — tourist destinations see 70–85%, while suburban markets may struggle to hit 50%. Always model your specific market.
Is Airbnb better than long-term rental?
In tourist markets, STR can generate 2–3x long-term rental income. However, STR has higher operating costs, management complexity, regulatory risk, and seasonal variance. Freddie compares both for your specific property.
What are Airbnb regulations I should know about?
Many cities restrict or ban STR, require permits, limit nights per year, or mandate owner-occupancy. Always verify local zoning and HOA rules before buying for Airbnb. This is a major risk factor Freddie flags.
Can a distressed property work as an Airbnb?
Rarely without significant renovation. Airbnb guests expect turnkey condition — distressed properties need full renovation before listing. This makes the rehab-to-STR path capital-intensive compared to a clean wholetail exit.
What does Freddie analyze for short-term rentals?
Freddie analyzes estimated nightly rates, market occupancy, gross revenue, operating expenses, net cash flow, cap rate, cash-on-cash return, and deal score — then compares it against flip and long-term rental alternatives.
Run your Airbnb deal now
Free. No credit card. No expiration.