Free Rental Property Analysis
Complete rental analysis in seconds — cash flow, cap rate, DSCR, deal score, and Rentcast rent data. Know before you buy.
Tell Freddie about your rental:
What you get — free
Rentcast Rent Data
Real comparable rent data for your specific address — not a national average.
True Cash Flow
Net monthly cash flow after every expense — mortgage, vacancy, management, maintenance, taxes, insurance.
Cap Rate & CoC
Both metrics calculated and benchmarked against your local market norms.
DSCR Analysis
Know if your rental qualifies for investor financing before you talk to a lender.
Deal Score 0–100
Freddie grades your rental A–F across all key performance metrics.
Free Forever
Complete rental analysis permanently free. No credit card required.
The rental analysis that told us to sell — and made us $115K
We ran a full rental property analysis on this Northern Virginia hoarder house the same day we got the lead. Rentcast showed $2,100–$2,300/month for the market. At $210K acquisition with conventional financing, the cash flow came out to $195/month — a 2.2% cash-on-cash return. Freddie scored it 52/100 as a rental. Then we ran the wholetail: 100/100. $115,050 net profit in 30 days. The rental analysis didn't just tell us the rental numbers — it confirmed the flip. That's a complete analysis.
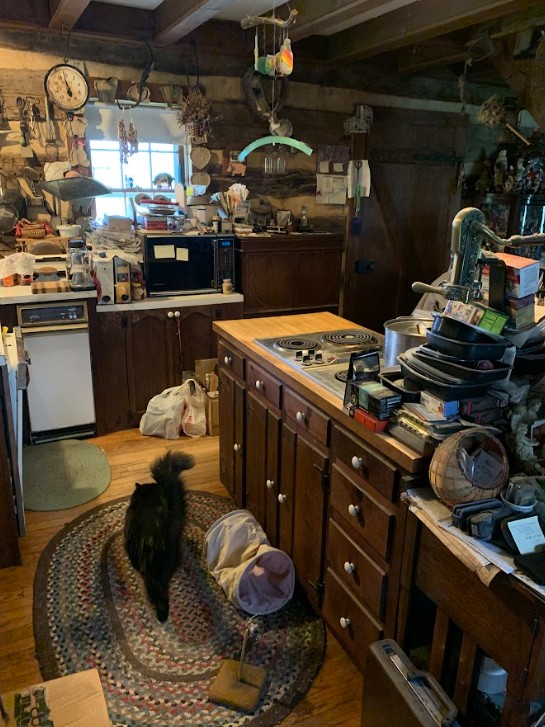
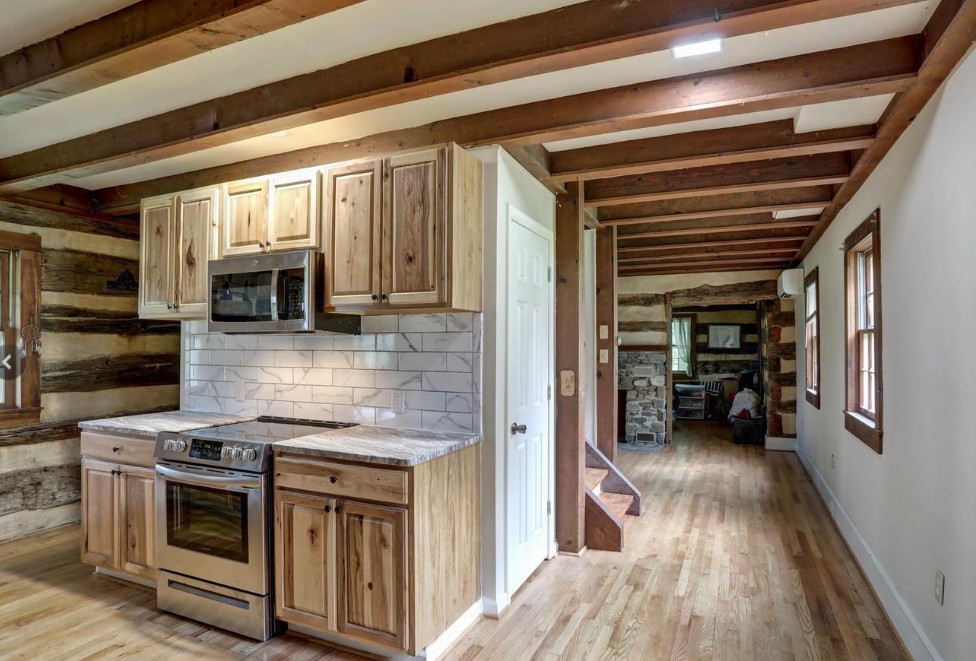
We sold the property as-is for $349K. The renovation pictured was completed by the buyer who purchased it from us. The $115,050 profit reflects our wholetail exit, not the renovation work.
Freddie scored the wholetail 100/100. A rental property analysis that only runs rental numbers is half an analysis. Run every exit.
"Rental property analysis lesson: a complete analysis tells you what the property is worth as a rental AND as a flip. Don't answer just one question."
Rental Property Analysis FAQ
What is a rental property analysis?
A rental property analysis evaluates whether a property makes financial sense as a long-term rental. It calculates gross rent, net operating income, cash flow, cap rate, cash-on-cash return, and deal score — giving you a complete picture before you commit.
What metrics matter most in rental property analysis?
The four most important metrics are: monthly cash flow, cash-on-cash return, cap rate, and DSCR. Cash flow tells you the monthly number, CoC tells you how hard your capital is working, cap rate measures property yield independent of financing, and DSCR determines loan qualification.
How do I analyze a rental property from scratch?
Start with purchase price and market rent. Subtract vacancy (5-10%), operating expenses (taxes, insurance, management, maintenance), and debt service. What remains is cash flow. Freddie does this automatically from a plain-English description of your property.
How accurate are Rentcast rent estimates?
Rentcast pulls comparable rental data from active listings and recent leases in your specific zip code. It's directionally accurate for most markets. Always verify against actual current listings in your target neighborhood.
Should I buy a rental property in a high-cost market?
High-cost markets like Northern Virginia rarely cash flow well on leverage. The play is usually appreciation and equity capture — not monthly income. Freddie models both the cash flow reality and the long-term equity scenario so you can make an informed decision.
What is a good cap rate for a rental property?
Cap rate = NOI divided by purchase price. A 5-7% cap rate is common for suburban rentals. In high-cost markets, 4-5% is realistic. Freddie benchmarks your property cap rate against your local market automatically.
Run your rental property analysis now
Free. No credit card. No expiration.